The traps in Google Trends: which editing software the world has searched for since 2004
I used Google Trends and Wikipedia to measure which video editors people have searched for since 2004. Along the way, Google invented two false stories. How I spotted them and how to read this data properly.
Contains AI-generated images or voice
Also available in: Spanish · Portuguese
In the first piece I looked at what Oscar-nominated films are cut on: over the last twenty years, almost always Avid. But outside Hollywood nobody asks what an Oscar winner was cut on. They ask how it’s done. And that question starts in a search bar. This is the second chapter:
It looks simple: open Google Trends, type in five programs and you’re done. It isn’t. Google Trends has traps that invent stories, and if you don’t spot them you end up telling something that never happened. Here are the ones I ran into, in the order they appeared.
1. What Google Trends measures (and what it doesn’t)
Google Trends is Google’s free tool that shows how much something has been searched for over time. It doesn’t give absolute searches: it gives an index from 0 to 100, where 100 is the moment of highest interest within that comparison.
What went wrong. The first thing to be clear about is that it measures attention, not users. A professional editor almost never googles the program they use every day; a beginner searches all the time. That’s why the video says, at the bottom and from the start: “Measures searches, not users”.
Tip. Put the warning on screen, not just in the text next to the video. Videos get shared without the text.
2. First trap: “topics” are born and die
Google Trends lets you look up a search term (what people type, for example “capcut”) or a topic, a Google entity that groups every way of searching for the same thing, in any language. Topics are usually the better choice: they’re cleaner. The problem is that a topic starts counting when Google creates it, not when the program is born.
What went wrong. CapCut’s topic doesn’t exist until April 2024. If you use it, CapCut seems to appear out of nowhere in 2024, when people had been searching for it for years:
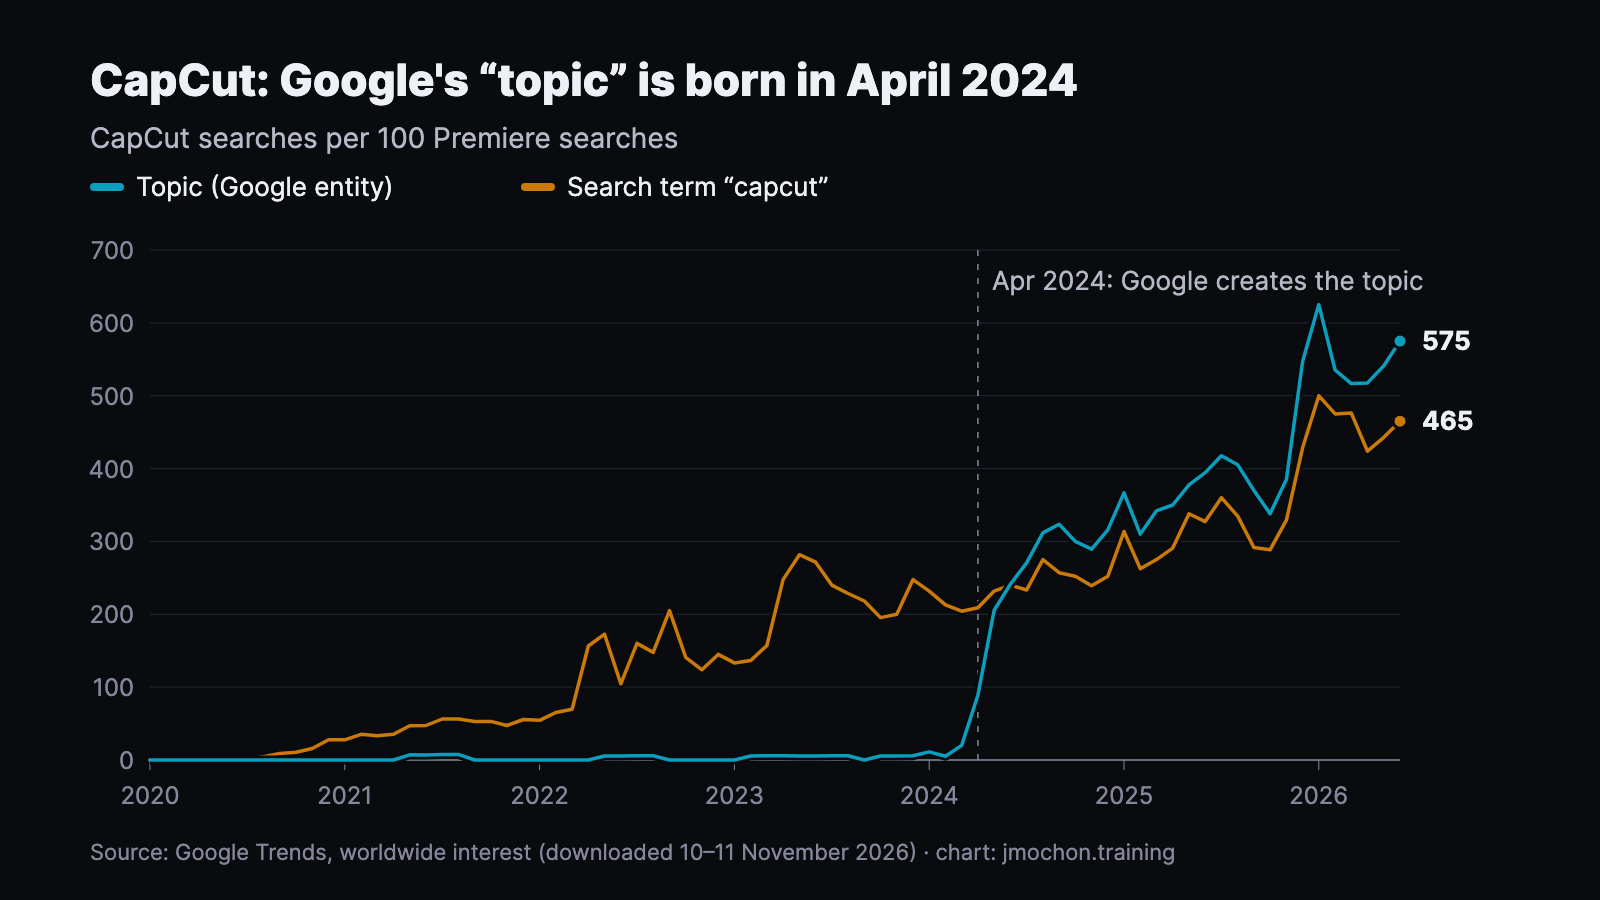
In this chart, the topic jumps from 20 to 206 searches per 100 Premiere searches between March and May 2024. The term “capcut” had already been hovering around 200 since 2023. The jump is Google’s, not CapCut’s.
Two more of the same kind:
- Final Cut Pro X is a different topic from Final Cut Pro until Apple dropped the “X” in 2020. If you don’t add them up, between 2011 and 2020 Final Cut loses 30 to 45% of its searches (in June 2019, 14 versus 25).
- Nuke, the compositing software, shares its topic with PHP-Nuke (a website manager from the 2000s) between 2004 and 2006. That’s why I left it out.
What I did. CapCut as a search term; Final Cut adding up its two topics; Nuke, out.
Tip. Before you trust a sudden jump, compare the topic with the search term on the same chart. If only one of them jumps, it’s an artefact.
3. Second trap: Premiere collapses in 2026 (and it isn’t true)
What went wrong. When I already had the video cut up to October 2026, the Premiere topic was nosediving from the summer on. It looked like the news of the year. I compared it with the search term again:
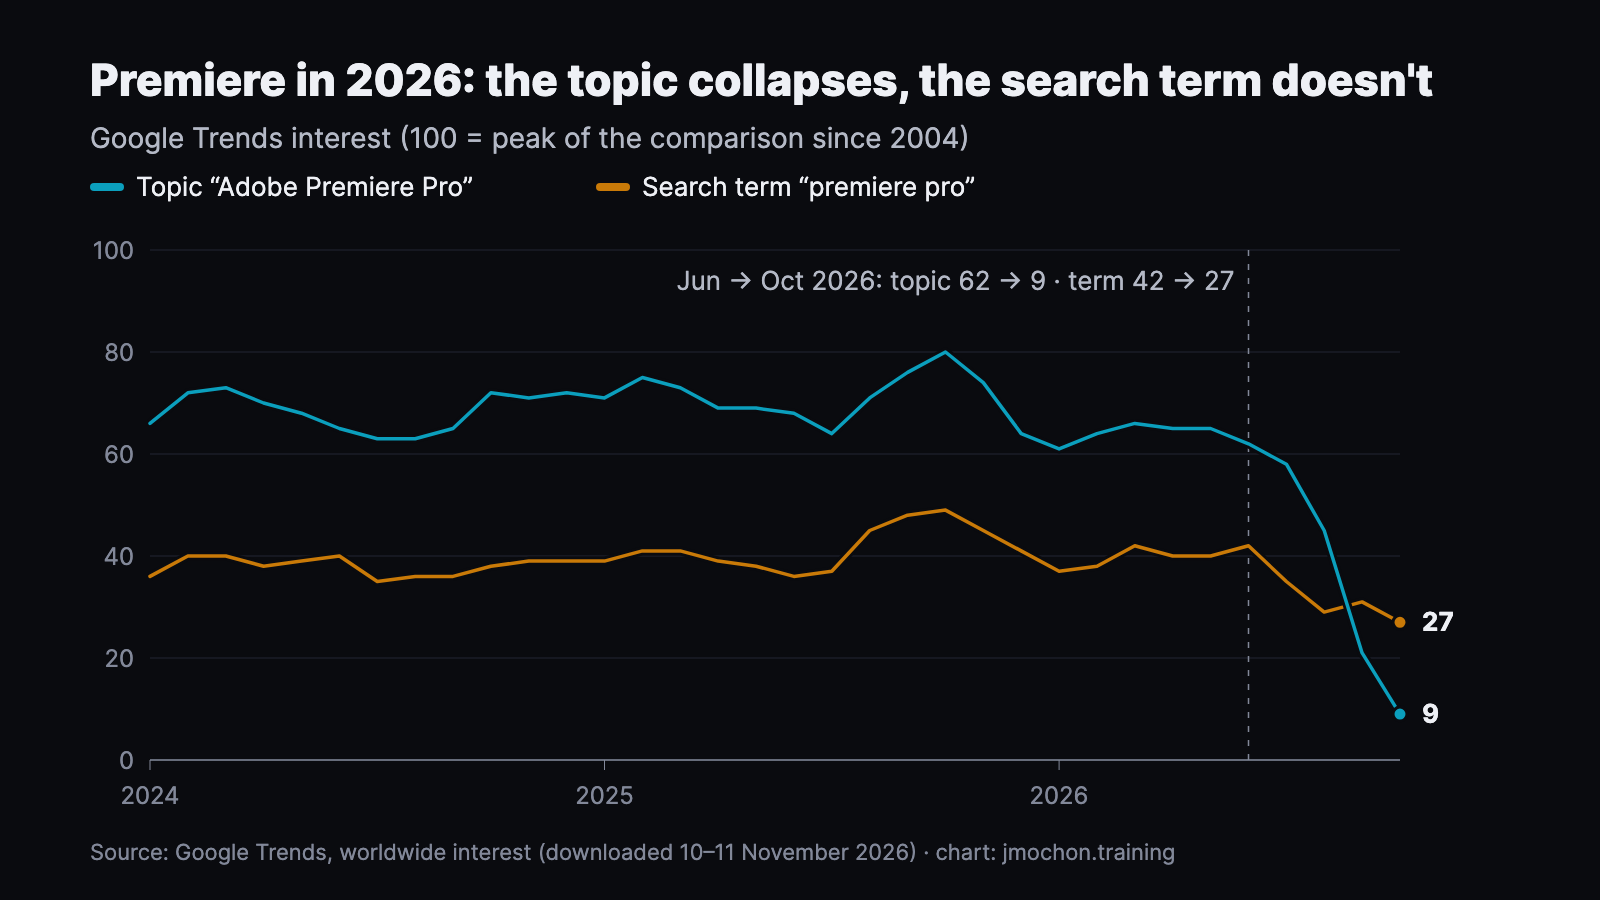
Between June and October 2026, the topic drops from 62 to 9 and the term “premiere pro” only from 42 to 27, a normal decline. If people had stopped searching for Premiere, both would fall.
Why. I don’t know for sure. Most likely Google reorganised the entity (Adobe renames its products often). What I do know is that it isn’t reliable data.
What I did. End the video in June 2026, the last month in which the two agree.
Tip. Always look at the latest months with a magnifying glass: that’s where Google recalculates the most.
4. Third trap: comparing more than five programs
What went wrong. Google Trends only lets you compare five things at a time, and I had more. If you run two separate queries, each has its own 100 and they can’t be combined.
What I did. Chain the groups: in each query I repeat an anchor program (Premiere or Avid) and rescale the rest against it. To check it, I worked out some programs two different ways (with different anchors). The differences stayed between 0.6 and 4.2%.
Tip. If you chain, check the chain two ways. If the differences go beyond a few points, the chain doesn’t hold.
5. Wikipedia as a second opinion: “no data” isn’t zero
So as not to depend on Google alone, I also pulled the page views of each program’s article on the English Wikipedia, with the Wikimedia page views API, which gives the daily views of any article since July 2015.
What went wrong. DaVinci Resolve didn’t have its own article until September 2018, and CapCut’s was a redirect to ByteDance until February 2024. If you draw those gaps as zero, it looks as if nobody cared about them.
Tip. Tell “zero” from “no data”. On a chart, a gap has to look like a gap.
6. Hysteresis: how to stop two bars from flickering
What went wrong. When two programs have almost the same interest, they overtake each other every month by tiny differences, and in the video the rows keep jumping places.
What I did. Apply hysteresis, the same idea as a thermostat: a program only overtakes the one above it if it beats it by more than 4%. Otherwise it stays where it was.
Tip. In any animated ranking, set a threshold for changing places. The order reads better and you lose nothing important.
7. What you get when you do it right
- 2009–2016: Vegas is the most searched: a whole generation teaching itself, with tutorials.
- June 2011: Final Cut Pro X comes out. Curiosity spikes and then fades.
- March 2016: Premiere takes back first place.
- From 2020: CapCut, the phone editor, appears. In April 2026 it’s searched 4.5 times more than Premiere (three-month average), so much that the meter clips in the video.
- January 2022: DaVinci Resolve, born for colour grading and with a free version, overtakes Final Cut. May 2026: it overtakes Premiere.
8. The Avid paradox
And the punchline. In April 2026, Avid gets 0.14% of the searches for these editors. In Hollywood, between 2004 and 2026, it was used to cut 84% of the documented Oscar nominees. Both figures are true at the same time. My reading: Avid users usually work in a cutting room with an assistant, an established workflow and training from their company: they don’t need to ask Google. That’s why a search engine is very good at measuring who’s learning and very bad at measuring who already knows.
How the video is made
The video is generated with HyperFrames, which turns an animated web page into video. The voice is mine, cloned locally with Voicebox and checked sentence by sentence with whisper.cpp. That’s why it carries the EU’s official AI-generated content label from the first frame. The English and Portuguese versions are built from the project, not dubbed; in the first piece I explain why and what went wrong.
If you want to try it
- Google Trends measures attention, not users: put it on screen.
- Faced with any sudden jump, compare the topic with the search term.
- Distrust the latest months. Cut where the data agrees.
- More than five programs: chain them with an anchor and check the chain two ways.
- On Wikipedia, “no article” means “no data”, not zero.
- In animated rankings, add hysteresis (I used 4%).
- Tell what the data can’t see: the Avid paradox is the best part of the story.
If this has made you want to try the program that has grown the most in this story, in the DaVinci Resolve course you learn it from scratch to delivering a complete project.
Get these tests once a month in your inbox: join the newsletter.